Access Data In The Format You Need

When you need real estate market data, different situations call for different formats. Browse interactive dashboards, download complete datasets, or integrate data programmatically through our API. Choose the access method that fits your workflow.

Multiple screens showing different data visualization formats and export options

Data Access Methods

Interactive Dashboards

When you want to explore data visually without technical setup, use our web-based dashboards. Filter by comuna, neighborhood, property type, and time period. See trends through charts and maps. Export specific views as images or PDFs for reports and presentations.

Downloadable Datasets

When you need raw data for your own analysis, download complete datasets in CSV or Excel format. Transaction histories, building permit records, vacancy data, and rental price surveys available as structured files. Updated monthly with new information from official sources.

API Access

When you want to integrate real estate data into your own applications or automated workflows, use our REST API. Query specific data points, filter results programmatically, and receive responses in JSON format. Documentation includes code examples and endpoint specifications.

Modern dashboard interface displaying real estate analytics with interactive charts and filters

Interactive Dashboard Features

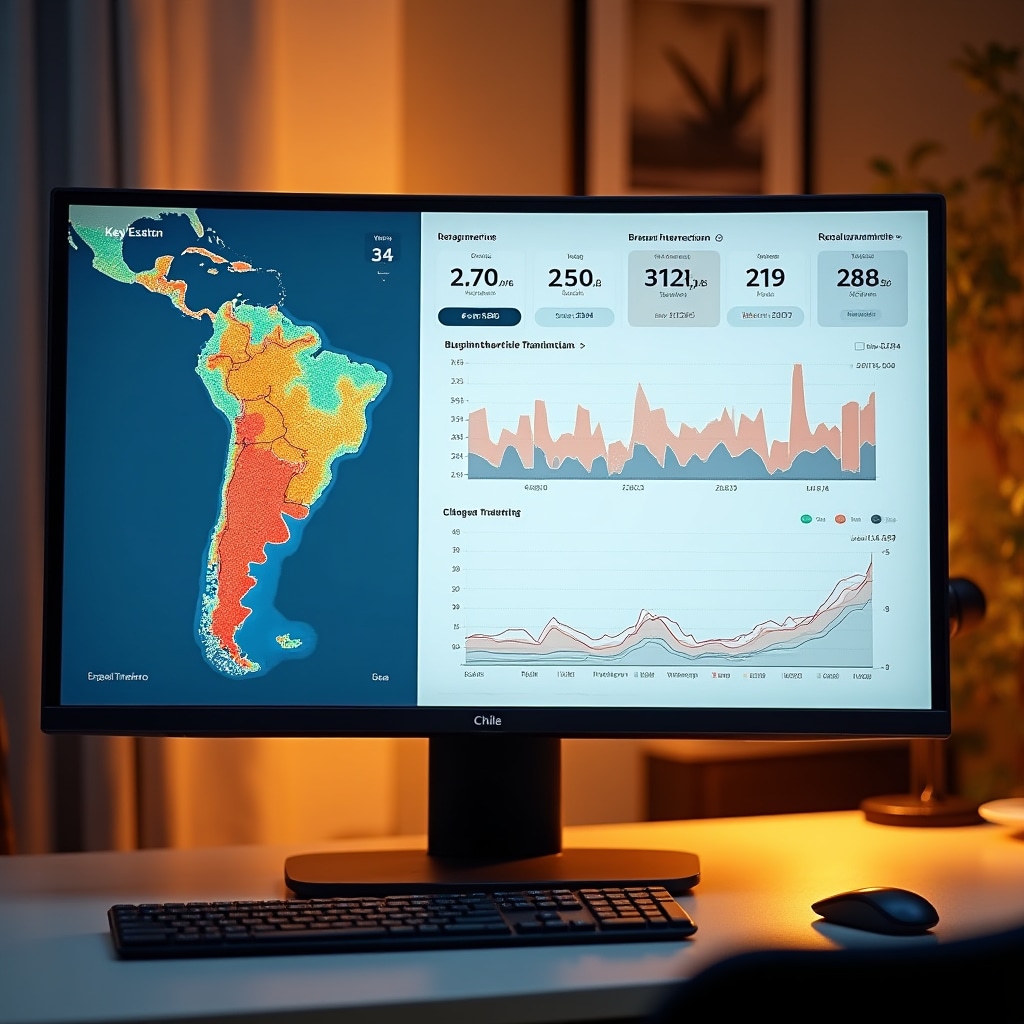
When you open the data explorer, you see a clean interface designed for exploration. No training required - the controls are straightforward and the visualizations update as you adjust filters.

  • Geographic filters for comuna and neighborhood selection
  • Property type filters for apartments, houses, commercial properties
  • Time period selection from monthly to multi-year views
  • Multiple data layers you can overlay for comparison
  • Map-based exploration with heat map visualizations
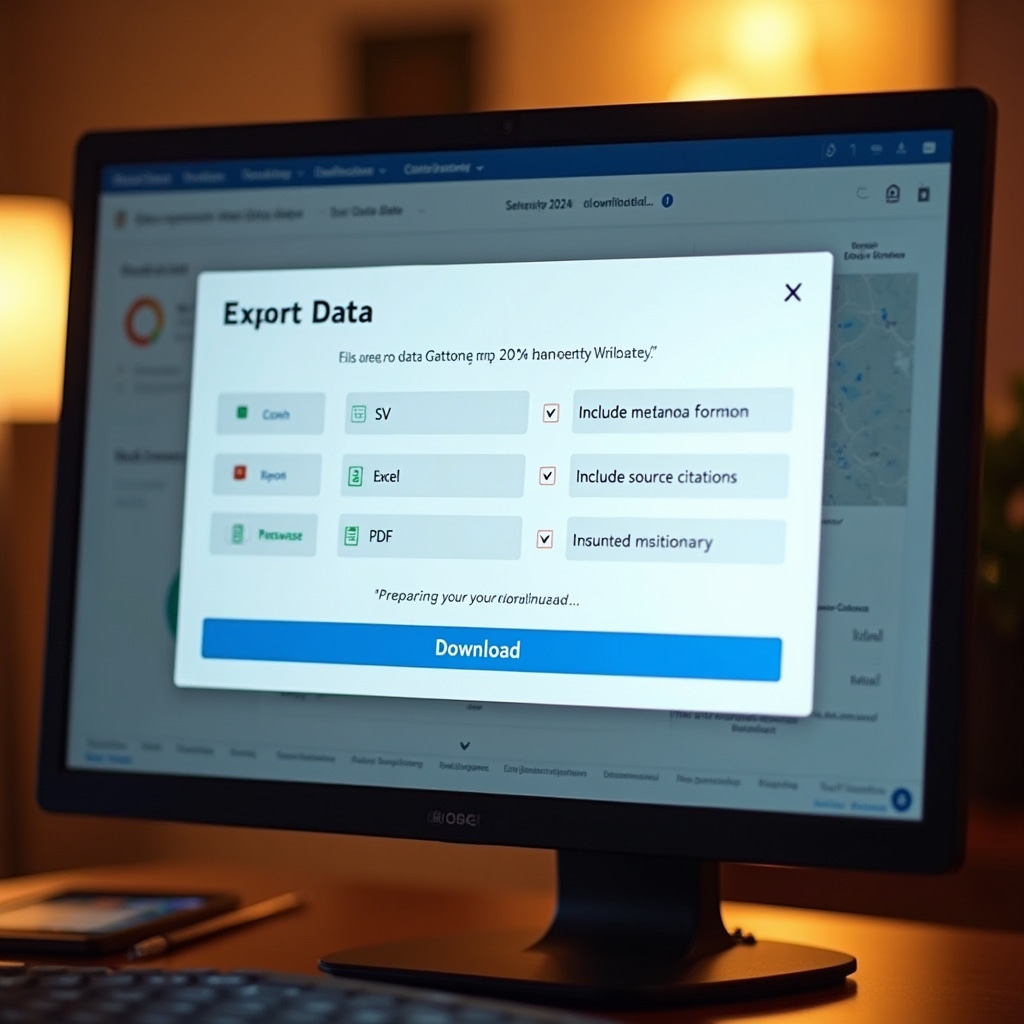
  • Export current view as PNG, PDF, or data table

Dataset Download Options

When you download data files, you receive complete datasets organized for analysis. Each file includes metadata explaining column definitions, data sources, and collection dates.

CSV format works with any spreadsheet software or data analysis tool. Excel format includes pre-formatted sheets and basic pivot tables to help you start exploring immediately.

Datasets are updated on the first of each month with new transaction records, building permits, and market survey results from the previous month.

Computer screen showing data export process with multiple file format options

API Integration

REST Endpoints

When you need programmatic access, our REST API provides endpoints for all data categories. Query transaction prices, building permits, vacancy rates, and rental averages through standard HTTP requests. Rate limits are generous for research and analysis use.

Query Parameters

When you make API requests, use query parameters to filter results. Specify geographic areas by comuna code, filter by property type, set date ranges, and limit result sets. The API returns only the data you request, keeping responses efficient.

Response Format

When the API responds, you receive structured JSON with consistent field names across all endpoints. Each response includes metadata about the query, result counts, and data timestamps. Error responses provide clear explanations when requests cannot be fulfilled.

Documentation

When you start using the API, comprehensive documentation guides you through authentication, endpoint structure, parameter options, and response formats. Code examples in Python, JavaScript, and R show common use cases and integration patterns.

Academic researcher working with real estate data on laptop in university library setting

Data Usage Scenarios

When journalists research housing market stories, they use the dashboard to identify trends and export charts for articles. When academic researchers conduct studies, they download complete datasets for statistical analysis. When developers build property valuation tools, they integrate the API for real-time data access.

When individual homebuyers compare neighborhoods, they explore the interactive maps. When policy analysts evaluate urban development, they examine building permit patterns over time. When real estate professionals track market conditions, they monitor monthly data updates.

Each format serves different needs. Choose the access method that matches your workflow and technical requirements.

Start Working With The Data

Open the interactive explorer, download datasets, or review API documentation. All access methods are free and require no registration for basic use.