
How The Explorer Works
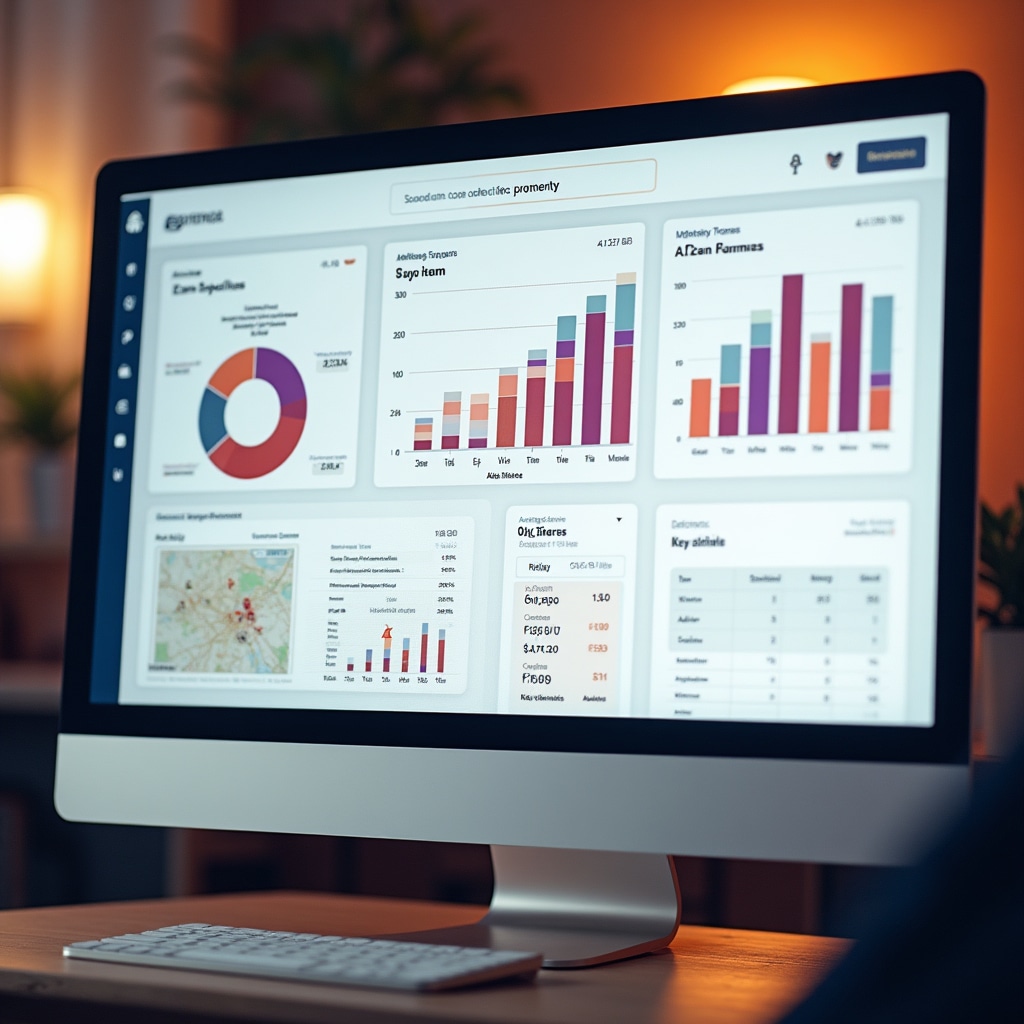
When you open the data explorer, you start with a map view of Chile organized by comuna. Click any area to drill down into neighborhood-level data. Use the sidebar filters to select property types, time periods, and data categories.
The dashboard updates immediately as you adjust filters. Charts show trends, maps display geographic patterns, and tables present detailed numbers. Export any view as an image or download the underlying data for your own analysis.
No account required. No usage limits. The full dataset is available to everyone who visits the platform.